S&P 500 closed Wednesday 4/16 at 5276, down 2.2% for the day, down 8.8% since election day, down 14.1% from ATH [View all]
Last edited Wed Apr 16, 2025, 05:50 PM - Edit history (45)
ATH is all-time high.
I only follow the S&P 500, as it is by far the best measure of the three (Dow, S&P 500, and Nasdaq) of the total U.S. stock market and far more representative of what people have on average. But see bottom of this post for a graph of the DOW, which closed at 39,669, down 700 points (-1.7%) for the day.
The S&P 500 closed Wednesday April 16 at 5276, down 2.2% for the day,
and down 8.8% from the 5783 election day closing level,
and down 12.0% from the inauguration-eve level,
and down 10.3% year-to-date,
and down 14.1% from its all-time closing high of 6144 on Feb 19. (we were down 18.9% at the 4/8 close, nearing a bear market which is 20% down. )
S&P 500
# Election day close (11/5/24) 5783
# Last close before inauguration day: (1/17/25): 5997
# 2024 year-end close (12/31/24): 5882
# All-time closing high (2/19/25): 6144
# Several market indexes: https://finance.yahoo.com/
# S&P 500: https://finance.yahoo.com/quote/%5EGSPC/
https://finance.yahoo.com/quote/%5EGSPC/history/
It is down 14.1% from its all-time closing high of 6144 on Feb 19. Anything between 5% and 10% down is in "pullback" territory. Corrections start at 10% down, and bear markets start at 20% down.
(It closed Thursday March 13 more than 10% down, making it officially the start of a correction. I don't know when corrections end -- when a new closing high occurs???)
========================================================
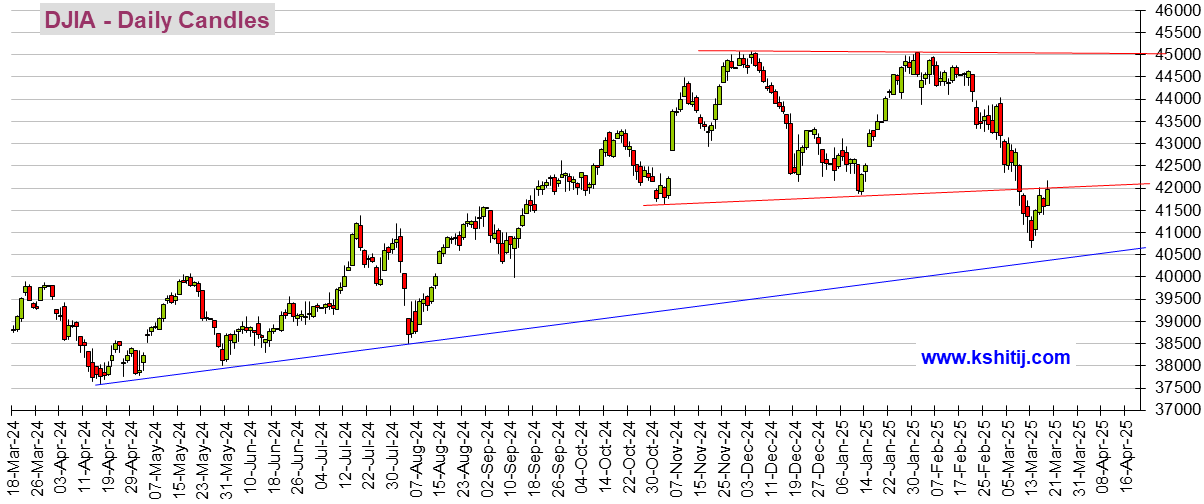
I'm not a fan of the DOW as it is a cherry-picked collection of just 30 stocks that are price-weighted, which is silly. But since there is an automatically updating embedded graphic, here it is. It takes several, like 6 hours, after the close for it to update, like about 10 PM EDT. It closed Tuesday at 40,369, and it closed Wednesday at 39,669, a drop of 1.7% (700 points) for the day.
I don't maintain statistics for the DOW like percent up or down since election day, or year-to-date, or from the all-time high etc. like I do for the S&P 500.
DJIA means Dow Jones Industrials Average. It takes about 6 hours after the close to update, so check it after 10 PM EDT
https://finance.yahoo.com/
DOW: https://finance.yahoo.com/quote/%5EDJI/
. . . . . . https://finance.yahoo.com/quote/%5EDJI/history/
I don't have an embeddable graph for the S&P 500, unfortunately, but to see its graph, click on https://finance.yahoo.com/quote/%5EGSPC/
 = new reply since forum marked as read
Highlight:
NoneDon't highlight anything
5 newestHighlight 5 most recent replies
= new reply since forum marked as read
Highlight:
NoneDon't highlight anything
5 newestHighlight 5 most recent replies