Economy
Related: About this forumS&P 500 closed Friday 10/31 at 6840, up 0.3% for the day, Good big tech news. Hawkish tone from fed officials
Last edited Fri Oct 31, 2025, 07:52 PM - Edit history (197)
In the future I will only be doing these twice a week: Tuesday and Friday, unless it's really interesting.10 Year TREASURY YIELD 4.10%, up 0.01 (about a week ago it fell to 3.98, its lowest point since April. Dunno what's caused the surge).
https://finance.yahoo.com/quote/%5ETNX/
Bitcoin: up 1.9% to 109,497
Market news of the day, Friday 10/31: https://finance.yahoo.com/
https://finance.yahoo.com/news/live/stock-market-today-dow-sp-500-nasdaq-climb-to-cap-winning-month-as-strong-earnings-easing-rates-fuel-amazon-tech-stocks-200208645.html
Scroll down to see earlier in the day reports
The Nasdaq Composite (^IXIC) rose 0.6%, while the S&P 500 (^GSPC) gained 0.3%, both restoring solid gains after wavering earlier in the session. The Dow Jones Industrial Average (^DJI), which includes fewer tech stocks, rose 0.1%.
All three major averages ended the month with wins, with the Nasdaq gaining more than 4% for a second month in a row. The tech-heavy index scored its seventh consecutive monthly victory, while the S&P 500 and Dow notched their sixth month of wins in a row. All three indexes ended with solid weekly gains, as well.
Fresh "Magnificent Seven" earnings reports rekindled optimism for sustained growth for tech megacaps, easing concerns about overspending on AI infrastructure.
Amazon shares rose around 10% and closed at an all-time high, after its third quarter results easily topped analysts' forecasts. In particular, its cloud division, Amazon Web Services, posted a 20% jump in revenue, signaling renewed strength in enterprise demand.
Apple (AAPL) also tapped its own record on the heels of stronger-than-expected results and upbeat guidance for the all-important holiday quarter. The stock hit a high above $277 shortly after the market open but quickly reversed direction.
Elsewhere in tech, Nvidia (NVDA) shares fluctuated as the company made a fresh push into South Korea, saying it would supply as many as 260,000 of its AI chips to companies and the country’s government. Meanwhile, shares in Netflix (NFLX) held onto gains after the media giant announced a 10-for-1 stock split.
Federal Reserve officials stepped up to speak for the first time since this week's meeting, which brought an interest rate cut and revealed deepening divisions among policymakers. Kansas City Fed president Jeff Schmid said he would have preferred to hold rates steady, as inflation is "too high." Dallas Fed president Lorie Logan, who is not a voting member this year, said Friday that she would have preferred to hold steady.
Traders are paring bets on a rate cut in December. Just over 60% now expect one, compared with over 90% one week ago.
============
Yes, inflation is too high - Here's the CPI 3-month and month-over-month graphs
See more graphs, including the Core CPI, at https://www.democraticunderground.com/10143552691#post10
Both the CPI and the Core CPI averaged +3.6% over the last 3 months at an annualized rate, well above the Fed's 2% target.
============
How major US stock indexes fared Friday, 10/31/2025, AP,
https://finance.yahoo.com/news/major-us-stock-indexes-fared-203201386.html
For the week:
The S&P 500 is up 48.51 points, or 0.7%.
The Dow is up 355.75 points, or 0.8%.
The Nasdaq is up 520.09 points, or 2.2%.
The Russell 2000 is down 34.09 points, or 1.4%. ((The Russell 2000 is the small cap index -progree))
For the year:
The S&P 500 is up 958.57 points, or 16.3%.
The Dow is up 5,018.65 points, or 11.8%.
The Nasdaq is up 4,414.16 points, or 22.9%.
The Russell 2000 is up 249.22 points, or 11.2%.
=============================================
S&P 500 closed Friday 10/31 at 6840, up 0.3% for the day, and up 16.3% year-to-date
The S&P 500 closed Friday October 31 at 6840, up 0.3% for the day,
and up 18.3% from the 5783 election day closing level,
and up 14.1% from the inauguration eve closing level,
and up 16.3% year-to-date (since the December 31 close)
S&P 500
# Election day close (11/5/24) 5783
# Last close before inauguration day: (1/17/25): 5997
# 2024 year-end close (12/31/24): 5882
# Trump II era low point (going all the way back to election day Nov5): 4983 on April 8
# Several market indexes: https://finance.yahoo.com/
# S&P 500: https://finance.yahoo.com/quote/%5EGSPC/
https://finance.yahoo.com/quote/%5EGSPC/history/
========================================================
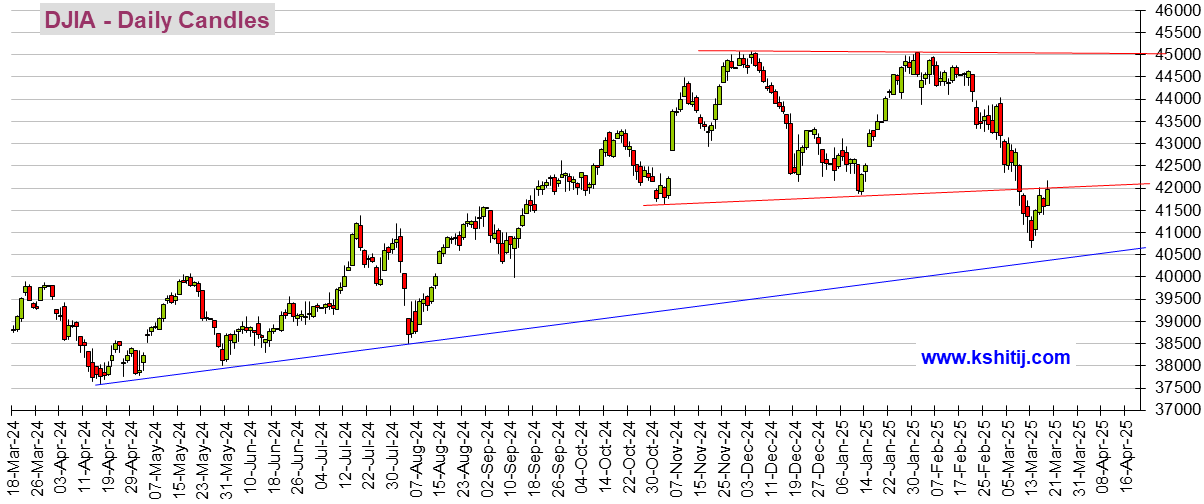
I'm not a fan of the DOW as it is a cherry-picked collection of just 30 stocks that are price-weighted, which is silly. It's as asinine as judging consumer price inflation by picking 30 blue chip consumer items, and weighting them according to their prices. But since there is an automatically updating embedded graphic, here it is. It takes several, like 6 hours, after the close for it to update, like about 10 PM EDT.
(If it still isn't updated, try right-clicking on it and opening in a new tab. #OR# click on https://finance.yahoo.com/quote/%5EDJI/ ).
The Dow closed Thursday at 47,522, and it closed Friday at 47,563, a rise of 0.1% (41 points) for the day
I don't maintain statistics for the DOW like percent up or down since election day, or year-to-date, or from the all-time high etc. like I do for the S&P 500.
https://finance.yahoo.com/
DOW: https://finance.yahoo.com/quote/%5EDJI/
. . . . . . https://finance.yahoo.com/quote/%5EDJI/history/
DOW
# Election day close (11/5/24) 42,222
# Last close before inauguration day: (1/17/25): 43,488
# 2024 year-end close (12/31/24): 42,544
DJIA means Dow Jones Industrials Average. It takes about 6 hours after the close to update, so check it after 10 PM EDT. Sometimes it takes a couple days (sigh)

I don't have an embeddable graph for the S&P 500, unfortunately, but to see its graph, click on https://finance.yahoo.com/quote/%5EGSPC/
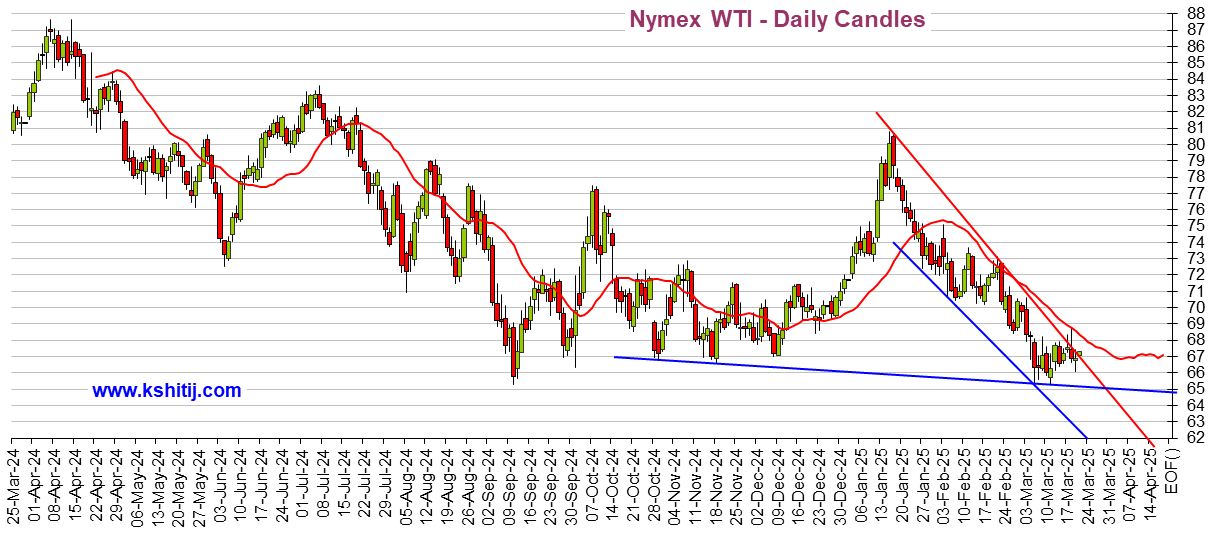
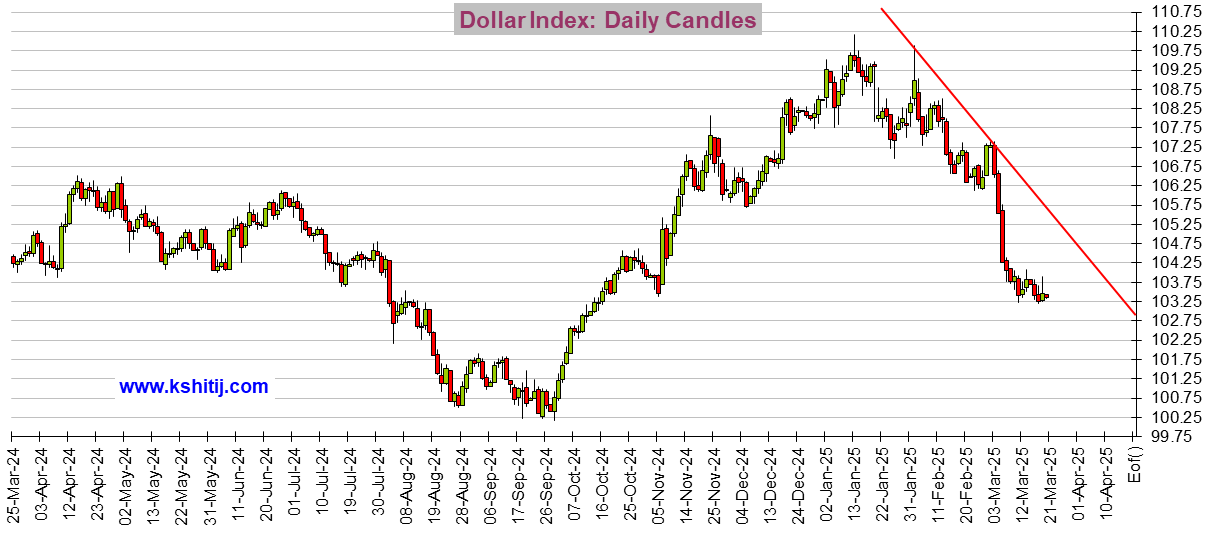
While I'm at it, I might as well show Oil and the Dollar:
Crude Oil

US Dollar Index (DX-Y.NYB)

If you see a tiny graphics square above and no graph, right click on the square and choose "load image". There should be a total of 3 graphs. And remember that it typically takes about 6 hours after the close before these graphs update.
🚨 ❤️ 😬! < - - emoticon library for future uses
progree
(12,484 posts)Last edited Tue Mar 4, 2025, 05:51 PM - Edit history (1)
How major US stock indexes fared Tuesday, AP, 3/4/2025
https://finance.yahoo.com/news/major-us-stock-indexes-fared-211928579.html
Here's the Year-to-date ones from the article:
# S&P 500: down 1.8%
# Dow: down 0.1%
# Nasdaq down: 5.3%
# Russell 2000 (the small caps): down 6.8%
Not in the article is that the S&P 500 is down 5.9% from its all time closing high of 6144 on Feb 19.
progree
(12,484 posts)See OP for the statistics.
progree
(12,484 posts)See OP for details
progree
(12,484 posts)see OP for details.
progree
(12,484 posts)Details in OP.
progree
(12,484 posts)See OP for details, and a graph of the DOW.
progree
(12,484 posts)Details in the OP.
progree
(12,484 posts)Details in the OP.
progree
(12,484 posts)Details in OP.
progree
(12,484 posts)Details in OP.
progree
(12,484 posts)Details in OP. ATH is All Time High. I don't kick this every market day, but it's been several days, and it's gotten well down on the listings, so I decided to kick it. It looks like the Trump slump since election day is about at an end, only 0.1% down since election day, and with 3 straight market days of gains. Since inauguration day, its down 3.7%.
progree
(12,484 posts)ATH is All Time High. Details in OP including more comparisons like down 5.4% since pre-inauguration day, and down 3.6% year-to-date.
I don't kick this every market day, but it's been several days, and it's gotten well down on the listings, so I decided to kick it. Note this closing is moments before the announcement of "Liberation Day" tariffs, so it's a good benchmark to compare to what follows in the next few days.
Arizona78
(8 posts)Trump’s bill could soon trigger a repo market crisis and push America and much of the world—toward bankruptcy. Something massive is on the horizon. Get ready.
Paul Krugman is deeply concerned about the uncontrolled rise in debt, which could sharply push up interest rates leading to bankruptcy.
https://paulkrugman.substack.com/p/trumps-big-beautiful-debt-bomb